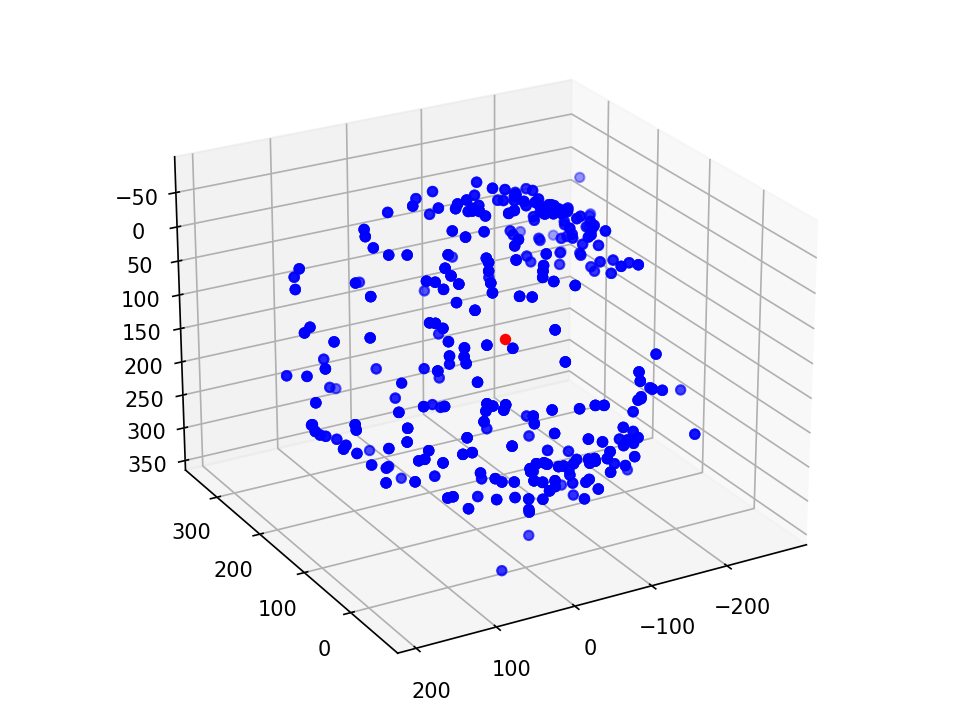
9軸センサーBMX055の磁気コンパスのデータ(x,y,z)を取得して可視化してみました。センサーはi2cでRaspberry Piに接続しています。
jupyter notebookで3Dプロットした様子
赤の点は、x,y,zのそれぞれの平均値を示す。

BMX055からデータを取得
 -*- coding: utf-8 -*-
#
# https://taku-info.com/bmx055howtouse-mag/
#

from smbus import SMBus
import time
import math
import datetime
import csv

# I2C
ACCL_ADDR = 0x19
ACCL_R_ADDR = 0x02
GYRO_ADDR = 0x69
GYRO_R_ADDR = 0x02
MAG_ADDR = 0x13
MAG_R_ADDR = 0x42

i2c = SMBus(1)

def bmx_setup():
    # acc_data_setup : 加速度の値をセットアップ
    i2c.write_byte_data(ACCL_ADDR, 0x0F, 0x03)
    i2c.write_byte_data(ACCL_ADDR, 0x10, 0x08)
    i2c.write_byte_data(ACCL_ADDR, 0x11, 0x00)
    time.sleep(0.5)

    # gyr_data_setup : ジャイロ値をセットアップ
    i2c.write_byte_data(GYRO_ADDR, 0x0F, 0x04)
    i2c.write_byte_data(GYRO_ADDR, 0x10, 0x07)
    i2c.write_byte_data(GYRO_ADDR, 0x11, 0x00)
    time.sleep(0.5)

    # mag_data_setup : 地磁気値をセットアップ
    data = i2c.read_byte_data(MAG_ADDR, 0x4B)
    if(data == 0):
        i2c.write_byte_data(MAG_ADDR, 0x4B, 0x83)
        time.sleep(0.5)
    i2c.write_byte_data(MAG_ADDR, 0x4B, 0x01)
    i2c.write_byte_data(MAG_ADDR, 0x4C, 0x00)
    i2c.write_byte_data(MAG_ADDR, 0x4E, 0x84)
    i2c.write_byte_data(MAG_ADDR, 0x51, 0x04)
    i2c.write_byte_data(MAG_ADDR, 0x52, 0x16)
    time.sleep(0.5)

def acc_value():
    data = [0, 0, 0, 0, 0, 0]
    acc_data = [0.0, 0.0, 0.0]

    try:
        for i in range(6):
            data[i] = i2c.read_byte_data(ACCL_ADDR, ACCL_R_ADDR + i)

        for i in range(3):
            acc_data[i] = ((data[2*i + 1] * 256) + int(data[2*i] & 0xF0)) / 16
            if acc_data[i] > 2047:
                acc_data[i] -= 4096
            acc_data[i] *= 0.0098

    except IOError as e:
        print("I/O error({0}): {1}".format(e.errno, e.strerror))

    return acc_data

def gyro_value():
    data = [0, 0, 0, 0, 0, 0]
    gyro_data = [0.0, 0.0, 0.0]

    try:
        for i in range(6):
            data[i] = i2c.read_byte_data(GYRO_ADDR, GYRO_R_ADDR + i)

        for i in range(3):
            gyro_data[i] = (data[2*i + 1] * 256) + data[2*i]
            if gyro_data[i] > 32767:
                gyro_data[i] -= 65536
            gyro_data[i] *= 0.0038

    except IOError as e:
        print("I/O error({0}): {1}".format(e.errno, e.strerror))

    return gyro_data

def mag_value():
    data = [0, 0, 0, 0, 0, 0, 0, 0]
    mag_data = [0.0, 0.0, 0.0]

    try:
        for i in range(8):
            data[i] = i2c.read_byte_data(MAG_ADDR, MAG_R_ADDR + i)

        for i in range(3):
            if i != 2:
                mag_data[i] = ((data[2*i + 1] * 256) + (data[2*i] & 0xF8)) / 8
                if mag_data[i] > 4095:
                    mag_data[i] -= 8192
            else:
                mag_data[i] = ((data[2*i + 1] * 256) + (data[2*i] & 0xFE)) / 2
                if mag_data[i] > 16383:
                    mag_data[i] -= 32768

    except IOError as e:
        print("I/O error({0}): {1}".format(e.errno, e.strerror))

    return mag_data

if __name__ == "__main__":

    bmx_setup()
    time.sleep(0.1)
    now_time = datetime.datetime.now()
    filename = 'test_' + now_time.strftime('%Y%m%d_%H%M%S') + '.csv'
    # ファイル,1行目(カラム)の作成
    with open(filename, 'a') as f:
        writer = csv.writer(f)
        writer.writerow(['Mag_x', 'Mag_y', 'Mag_z'])
    while True:
        #acc = acc_value()
        #gyro= gyro_value()
        mag = mag_value()
        theta = math.atan2(mag[1],mag[0]) * 180.0 / 3.141592
        if ( theta < 0 ):
            theta = theta + 360.0
        '''
        theta = 360.0 - theta
        print("Accl -> x:{}, y:{}, z: {}".format(acc[0], acc[1], acc[2]))
        print("Gyro -> x:{}, y:{}, z: {}".format(gyro[0], gyro[1], gyro[2]))
        print("Mag -> x:{}, y:{}, z: {}".format(mag[0], mag[1], mag[2]))
        '''
        print(theta)
        time.sleep(0.02)
        with open(filename, 'a', newline="") as f:
            writer = csv.writer(f)
            writer.writerow([mag[0], mag[1], mag[2]])
取得したデータをjupyter notebookで可視化
%matplotlib nbagg

import os
import pandas as pd
from mpl_toolkits.mplot3d import Axes3D
import matplotlib.pyplot as plt
import math
import numpy as np

### データの読み込み
df = pd.read_csv('BMX055/data4.csv')
print(df)
a_x=np.average(df['Mag_x'])
a_y=np.average(df['Mag_y'])
a_z=np.average(df['Mag_z'])
print(round(a_x,2),round(a_y,2),round(a_z,2))
# ここからグラフ描画

# グラフの入れ物を用意する。
fig = plt.figure()
#ax = Axes3D(fig)    <--- warning対策
ax = fig.add_subplot(111, projection='3d')
# 軸のラベルを設定する。
ax.set_xlabel('x')
ax.set_ylabel('y')
ax.set_zlabel('z')

# グラフを表示する。
ax.scatter3D(df['Mag_x'],df['Mag_y'],df['Mag_z'],color="blue")
ax.scatter3D(a_x,a_y,a_z,color="red")
plt.show()